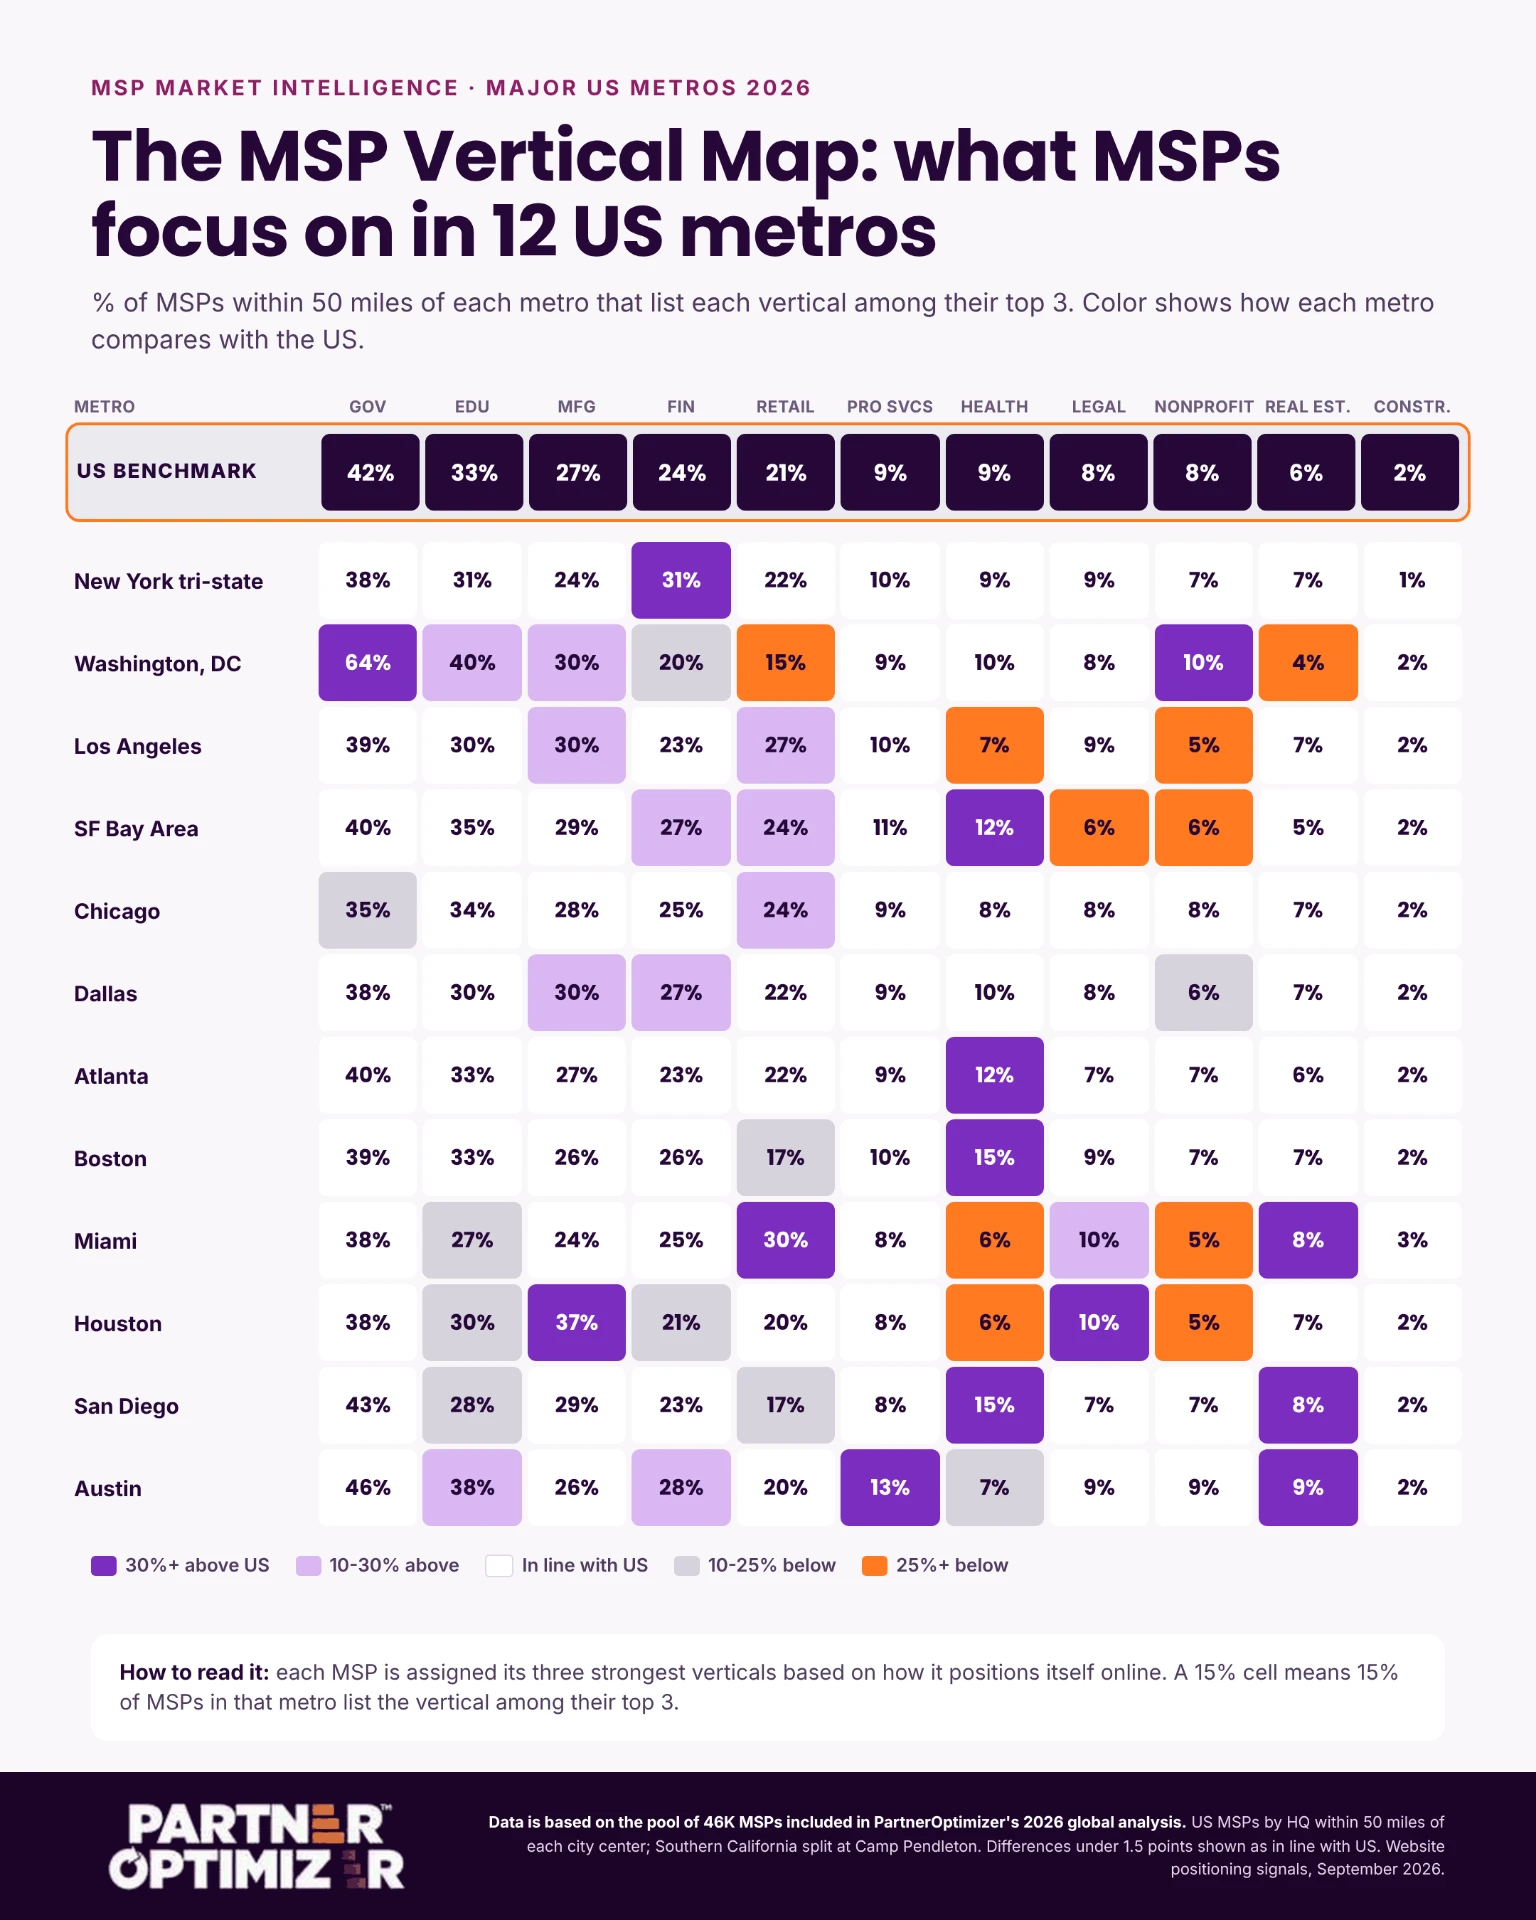
An MSP’s headquarters can tell a revealing story about its market. In Washington, DC, government dominates. In Houston, manufacturing stands out. In Miami, retail and hospitality moves into second place. Treating these businesses as one national category risks missing the local forces shaping how they compete.
That is the picture emerging from PartnerOptimizer’s September 2026 edition of “The DNA of MSP Growth.” Starting with a representative research cohort of approximately 46,000 MSPs worldwide, the team examined US MSPs headquartered within 50 miles of 12 major metropolitan areas. For each company, the analysis identified its three strongest industry verticals based on its online positioning.
The result is not simply a map of where MSPs are located. It is a view of how they present their expertise—and where local positioning differs from the broader US sector.
One common leader. Twelve local markets.
Government appears among the top three verticals more often than any other industry in every metro studied. Nationally, 42% of MSPs in the US baseline signal government among their top three. In the Washington, DC area, that share reaches 64%—nearly two in three.
What follows government is where the market becomes more distinctive:
- Houston leans industrial. Manufacturing appears among the top three verticals for 37% of local MSPs, ten percentage points above the 27% US baseline and almost level with government locally.
- Miami has a hospitality signature. Retail and hospitality ranks second at 30%, compared with 21% nationally. It is the only metro in this study where that category takes the number-two spot.
- New York puts finance alongside education. Both appear at 31%, with financial services seven percentage points above the US baseline.
- Boston and San Diego stand out in healthcare. In both metros, 15% of MSPs signal healthcare among their top three verticals, versus 6% in Houston and Miami—more than twice the share.
How NeuralPartner turns public signals into market intelligence
Behind the analysis is PartnerOptimizer’s proprietary NeuralPartner™ Engine. Its B2B technology-domain-optimized AI and data-mining tools surface business attributes from companies’ digital presence, helping the team identify patterns in industry focus, technology alignment, expertise and AI readiness. The PartnerOptimizer team then interprets those patterns in the context of a specific market and peer group.
This is curated research, not a generic prompt sent to a public AI assistant. The value lies in connecting company-level signals to an aggregated market view—and retaining the underlying company identities so a percentage can become an actionable research question.
There is an important distinction: these figures describe observable website positioning, not audited customer portfolios, revenue shares or proven delivery capabilities. A 15% healthcare figure means 15% of the MSPs in that metro list healthcare among their three strongest signaled verticals. Because each MSP can have three verticals, the percentages are not slices of a single 100% total.
For MSP owners: a sharper local growth conversation
For an MSP owner, the findings offer context for decisions about customer focus, services adjacency and go-to-market strategy. A national average cannot show whether a specialty is highly visible in a company’s own market, or whether its positioning blends into the local crowd.
The next question is not necessarily “Which vertical should we copy?” It is “Where does our expertise meet a real customer need—and how clearly do we communicate it compared with relevant peers?” A visible gap can be worth investigating, but it is not, on its own, proof of unmet demand.
MSP IQ Benchmark Reports bring that conversation down to the individual business, connecting company, market and competitive intelligence to more focused growth decisions.
“This is the sort of research that we crave as revenue strategists! PartnerOptimizer brings valuable insights into the priorities and focus areas of MSPs across major U.S. metropolitan markets. Before expanding into new markets, why not focus on underserved verticals within your existing ones? That could become a powerful sales strategy — capitalizing on untapped opportunities while leveraging your existing market presence, brand recognition, and local talent.”
Complimentary through October 31, 2026, in exchange for feedback within your account.
For channel leaders: the national IPP is only a starting point
An Ideal Partner Profile built around a national MSP average can hide meaningful local differences. For vendors selling into healthcare, legal or financial services, the useful question is not only whether specialists exist in a metro. It is which companies fit the required expertise, technology alignment and customer focus.
Behind every percentage in this research is a named MSP, even where the public slides withhold company names. That connection enables PartnerOptimizer to move from aggregate patterns to targeted partner research. Channel leaders can specify their vertical, target metro, expertise requirements or IPP, then investigate the companies that fit.
Define your Ideal Partner Profile with PartnerOptimizer’s IPP Agent, now in beta →